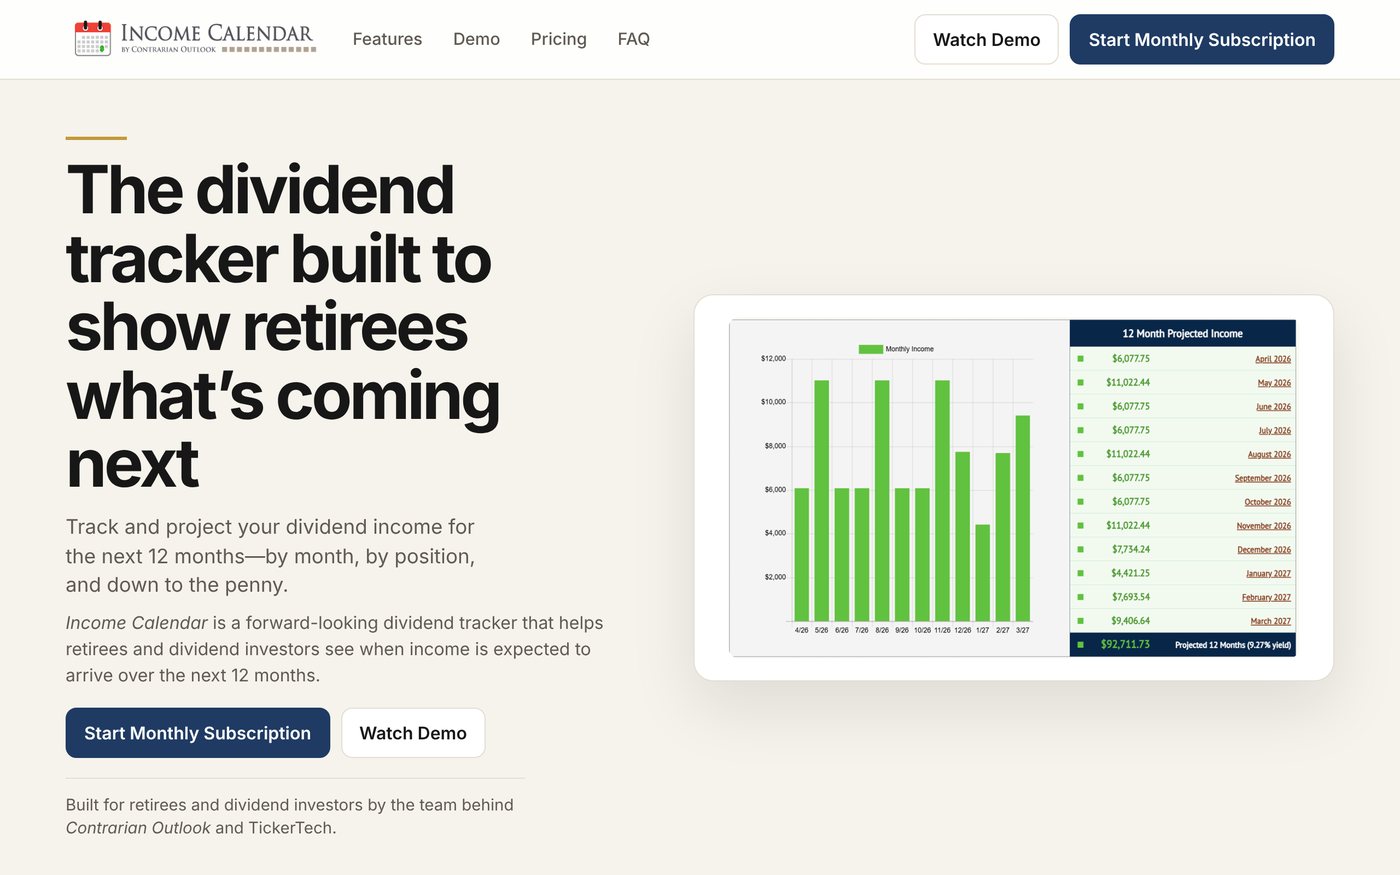
Income Calendar is a dividend tracker that looks forward. You add your holdings and it maps out every projected payment for the next 12 months: by month, by position and by date, down to the penny. It costs $8.99 a month, and there is a free preview at DividendTracker.com where you can try it with up to 10 holdings before you subscribe.
- Price
- $8.99/mo
- Free preview
- Up to 10 holdings
- Projection window
- 12 months
- Holdings (paid)
- Unlimited
Why I care about a forward-looking dividend calendar
Most brokerage apps are built to show you what already happened. You can see the dividend that hit your account last Tuesday, but it is a lot harder to answer the questions that actually matter when you live off your portfolio: How much is coming next month? Which months are going to be light? When is the next ex-dividend date I need to own the shares by?
For a lot of dividend investors, the usual answer to those questions is a spreadsheet. It works, until you own a mix of monthly payers, quarterly payers and option income ETFs whose payouts change every month. Then the spreadsheet turns into a part-time job.
That is the gap Income Calendar is built to fill. Instead of tracking what you were paid, it projects what you are about to be paid, and it puts every declaration, ex-dividend date and pay date on an actual calendar.
Who Income Calendar is built for
Income Calendar is built for retirees and income investors who plan their spending around dividend cash flow. If you own a mix of monthly payers, quarterly payers and option income ETFs, it pulls every projected payment into one forward-looking view, so you are not stitching it together yourself from brokerage statements and spreadsheets.
In my opinion, it is one of the cleanest answers I have seen to the question every income investor asks: how much is coming next month? Instead of looking at what you were paid in the past, it shows you what your portfolio is projected to pay next. It even has a DRIP mode, so you can see how reinvesting changes your future income.
How I tested it: a 10-holding income portfolio
To keep this real, I built a portfolio that looks a lot like what readers of this site actually own: a core dividend ETF, the big option income ETFs, a couple of monthly paying stocks and a few blue-chip quarterly payers. I used the free preview, which caps you at 10 holdings, so this is exactly what you will see if you try it yourself.
| Ticker | Name | Shares | Pays |
|---|---|---|---|
| $SCHD | Schwab U.S. Dividend Equity ETF | 300 | Quarterly |
| $JEPI | JPMorgan Equity Premium Income ETF | 150 | Monthly |
| $JEPQ | JPMorgan Nasdaq Equity Premium Income ETF | 150 | Monthly |
| $QQQI | NEOS Nasdaq-100 High Income ETF | 100 | Monthly |
| $SPYI | NEOS S&P 500 High Income ETF | 100 | Monthly |
| $O | Realty Income | 100 | Monthly |
| $MAIN | Main Street Capital | 100 | Monthly |
| $VZ | Verizon | 100 | Quarterly |
| $KO | Coca-Cola | 50 | Quarterly |
| $ABBV | AbbVie | 25 | Quarterly |
This is an example portfolio I picked to show off the tool, not a recommendation. Income Calendar valued it at about $65,485 when I ran it.
Step 1: Enter your holdings in the free preview
Head to the free preview page, type a ticker and a share count, and hit Add holding. You can also tick a DRIP box for any position you reinvest. Once you have your holdings in, you click Generate 12-Month Projection and the full Income Calendar demo opens with your portfolio loaded.
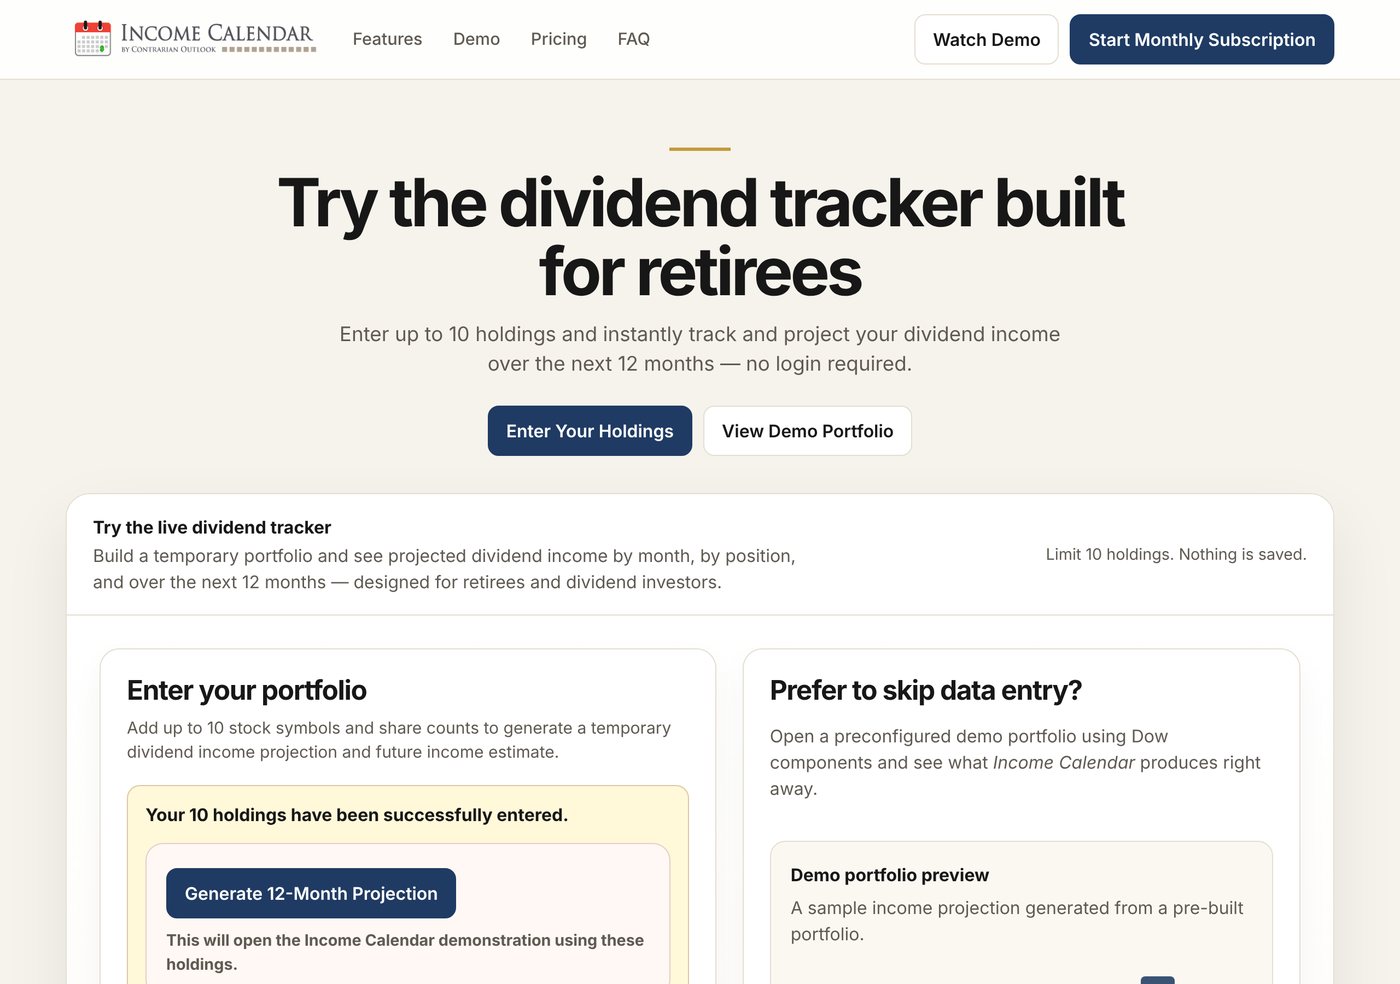
If you do not want to type anything, there is also a View Demo Portfolio button that loads a pre-built portfolio of Dow stocks so you can click around right away. Setup on the paid version is just as quick: you can import from your brokerage or enter positions by hand, and the company says most people see a full 12-month projection in about 7 minutes.
Step 2: The 12-month projected income view
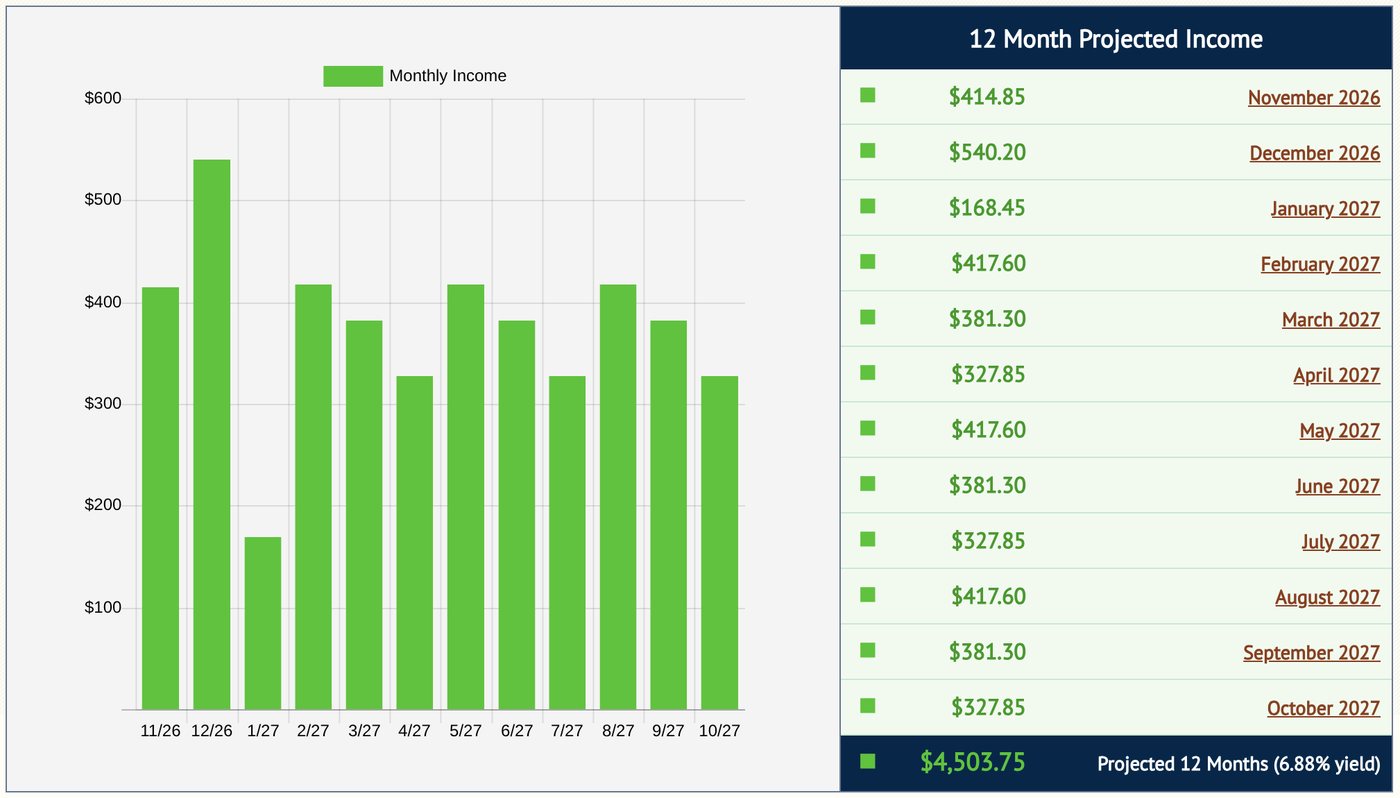
This is the first screen you see, and honestly it is the one I keep coming back to. A bar chart of every month for the next year, with the exact projected dollar amount next to each month and a 12-month total at the bottom.
Two things jumped out at me right away:
- December is the biggest month ($540.20) because the quarterly payers ($SCHD and $KO) land in the same month as the monthly payers, and $JEPI and $JEPQ are projected to pay twice in December (early December and again on December 31).
- January is the lightest month ($168.45) for the exact same reason. Because $JEPI and $JEPQ's year-end payment lands on December 31, January has no payment from either of them.
That is the kind of thing you would never notice from a yield number. On paper, a 6.88% yield on about $65,000 sounds like roughly $375 a month. In reality, my monthly income ranges from about $168 to $540. If you pay bills from your dividends, knowing that January is going to be light before January shows up is the whole point.
Want to see your own 12-month projection? The preview is free for up to 10 holdings.
Try the free preview →Watch the demoStep 3: See which holdings drive your income
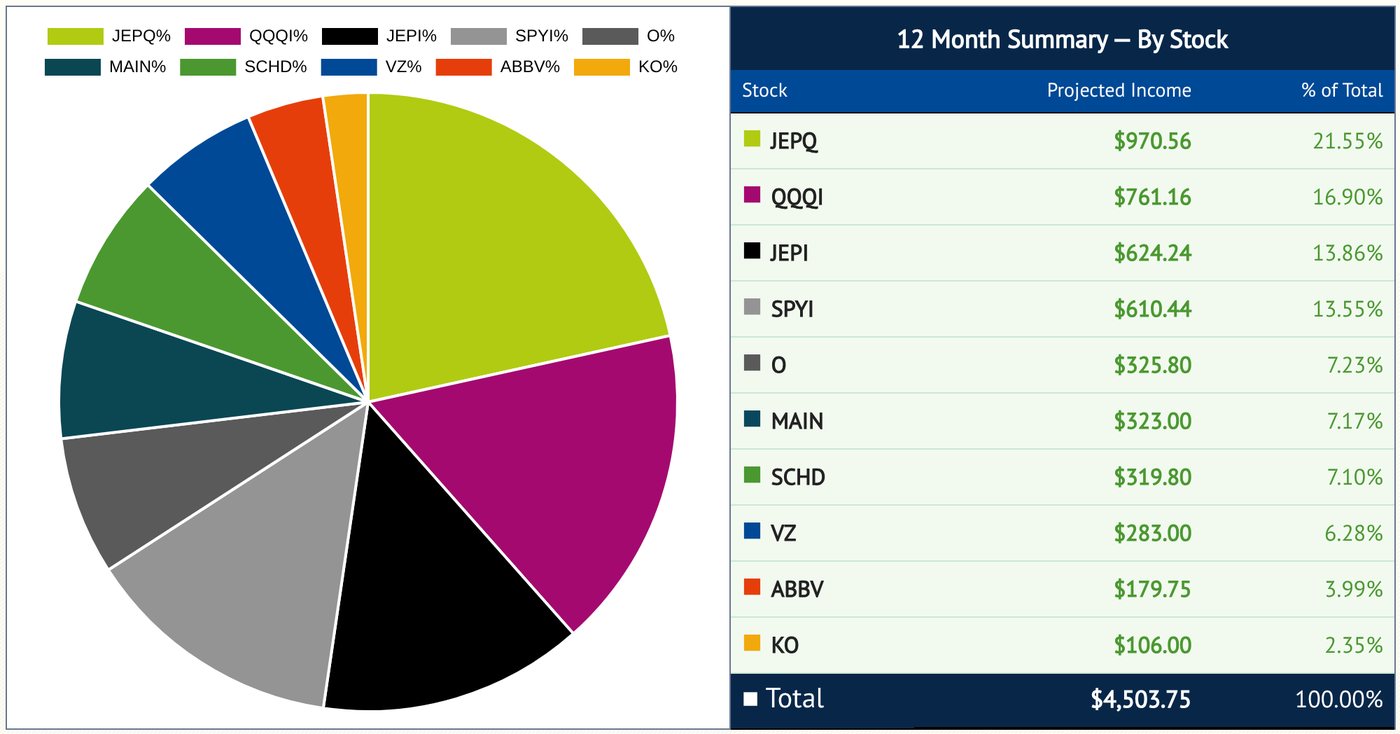
Click By Stock and you get a pie chart and table showing how much each position contributes over the next 12 months. This view was the most eye-opening one for me.
| Holding | Projected 12-mo income | % of total |
|---|---|---|
| $JEPQ | $970.56 | 21.55% |
| $QQQI | $761.16 | 16.90% |
| $JEPI | $624.24 | 13.86% |
| $SPYI | $610.44 | 13.55% |
| $O | $325.80 | 7.23% |
| $MAIN | $323.00 | 7.17% |
| $SCHD | $319.80 | 7.10% |
| $VZ | $283.00 | 6.28% |
| $ABBV | $179.75 | 3.99% |
| $KO | $106.00 | 2.35% |
| Total | $4,503.75 | 100% |
Add up the top four and you get the real story: $JEPQ, $QQQI, $JEPI and $SPYI produce about 66% of this portfolio's income, even though they are 4 of 10 holdings and only about 41% of the portfolio's value. Those option income ETFs adjust their payouts every month, so most of this portfolio's income moves with the options market.
That is not good or bad by itself, but it is something you want to know. The company calls this spotting income concentration, and it is one of the most useful things the tool does.
Step 4: What is still coming this year
The Remaining 2026 view lists every projected payment left in the calendar year, in date order, with a subtotal for each month. When I ran it, there was $751.40 still projected for the rest of 2026: $211.20 still to come in November and $540.20 in December.
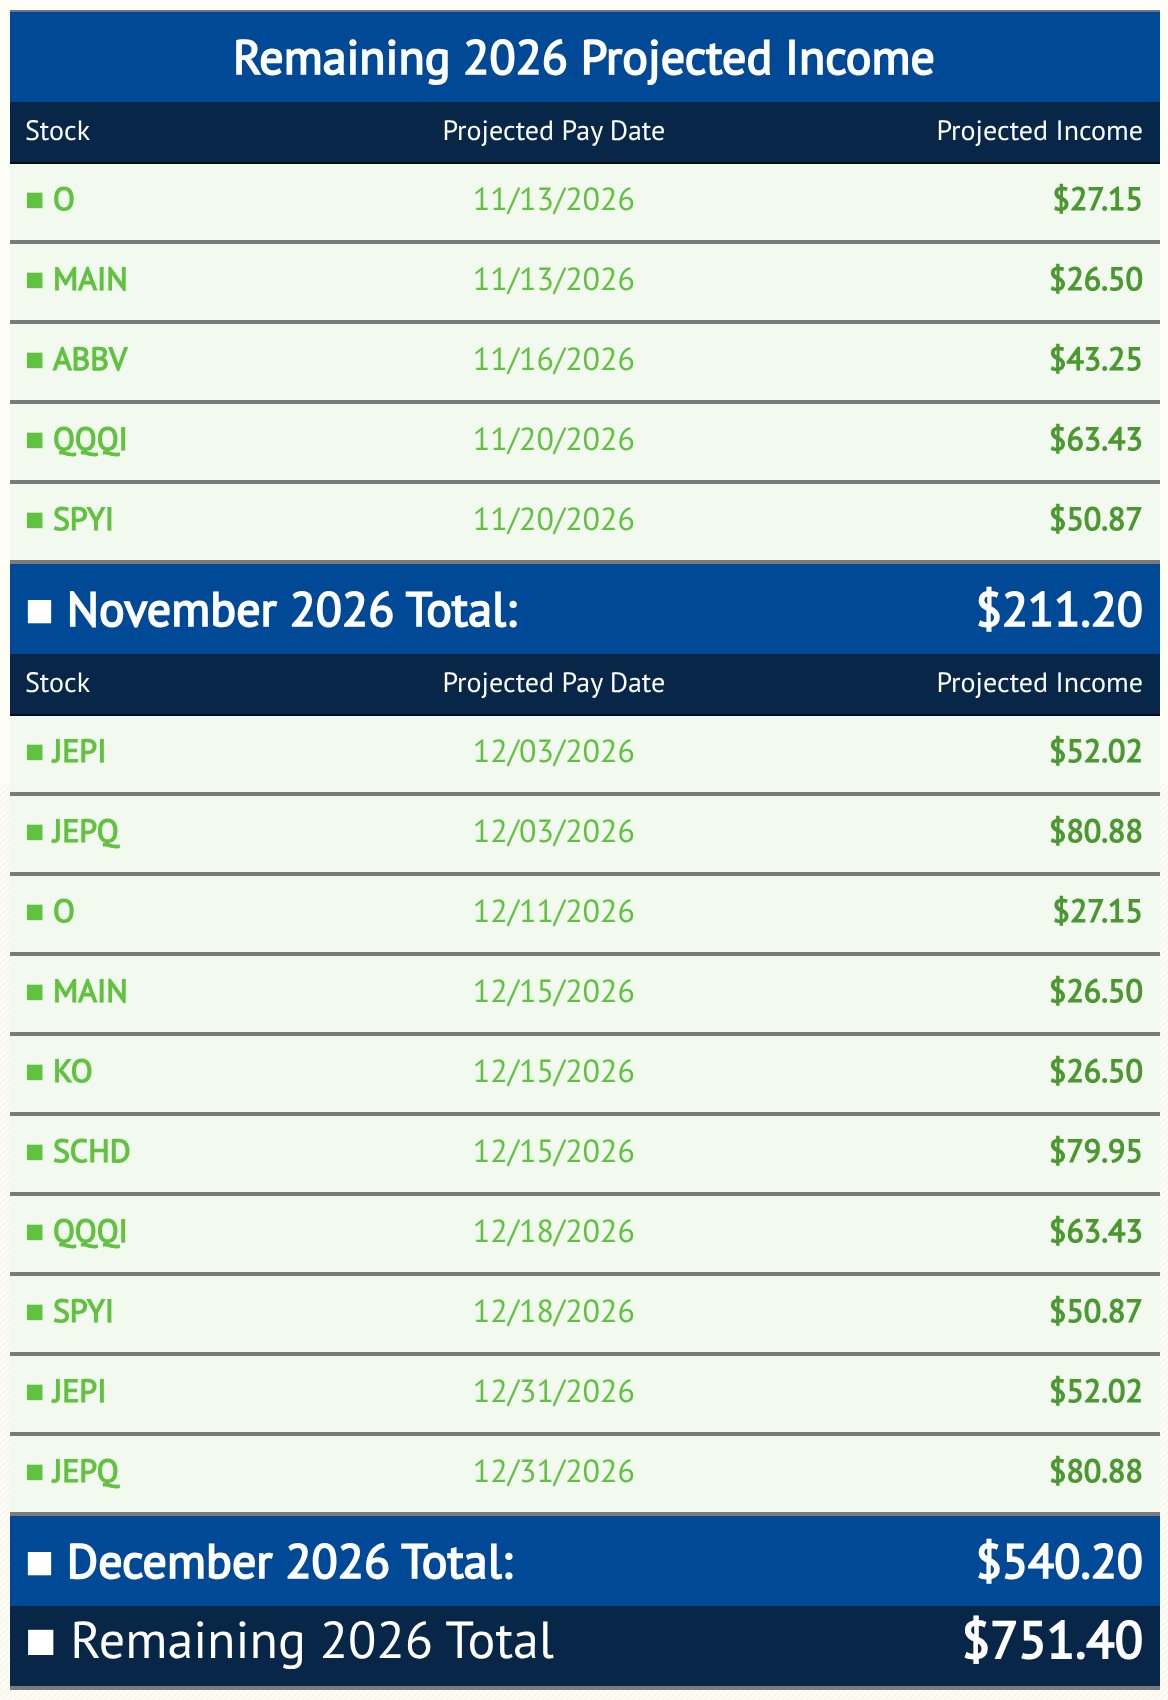
This is the screen I would use for year-end planning: what cash is coming before December 31, when it lands, and from which holding.
Step 5: The actual calendar (this is where it shines)
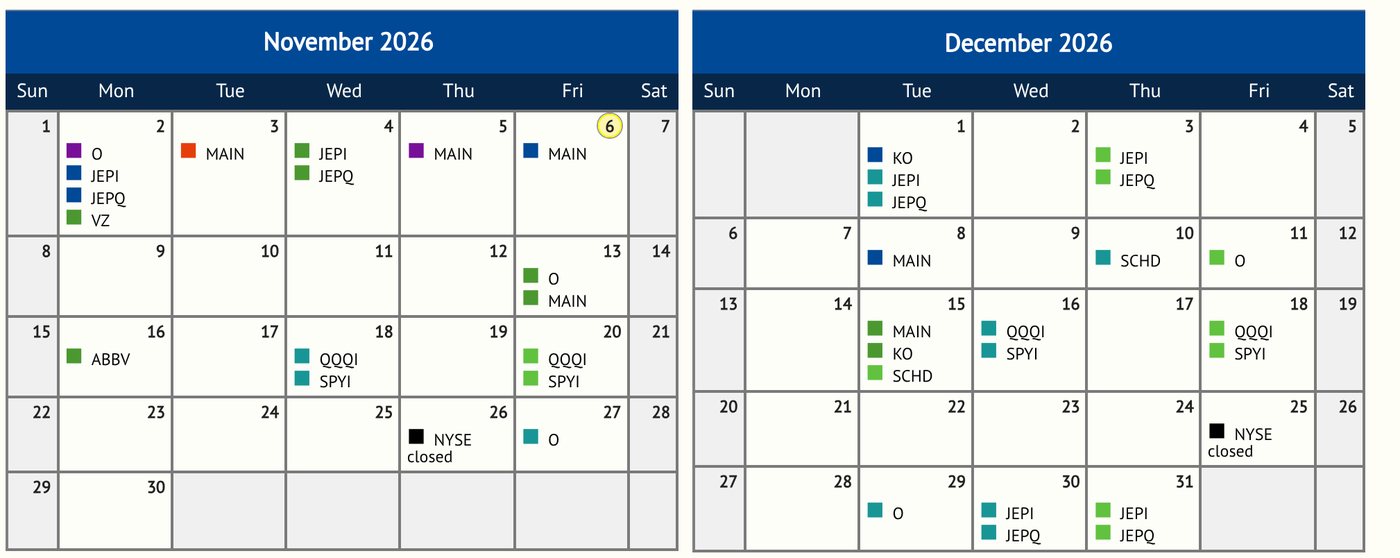
Click any month and you get a real calendar. The summary view shows which holdings have an event on each day, color-coded by type: declarations, ex-dividend dates, projected ex-dividend dates, payments and projected payments, plus earnings dates and market holidays.
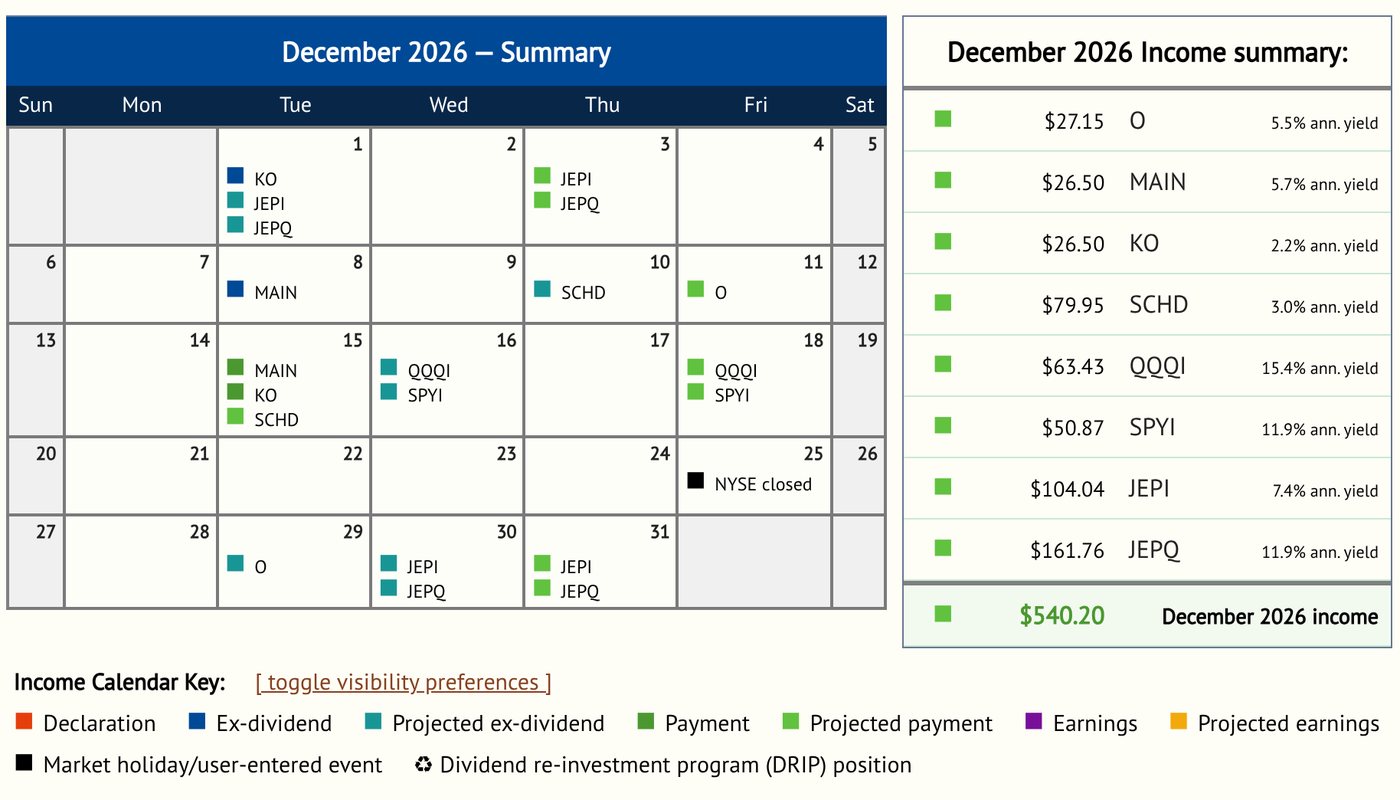
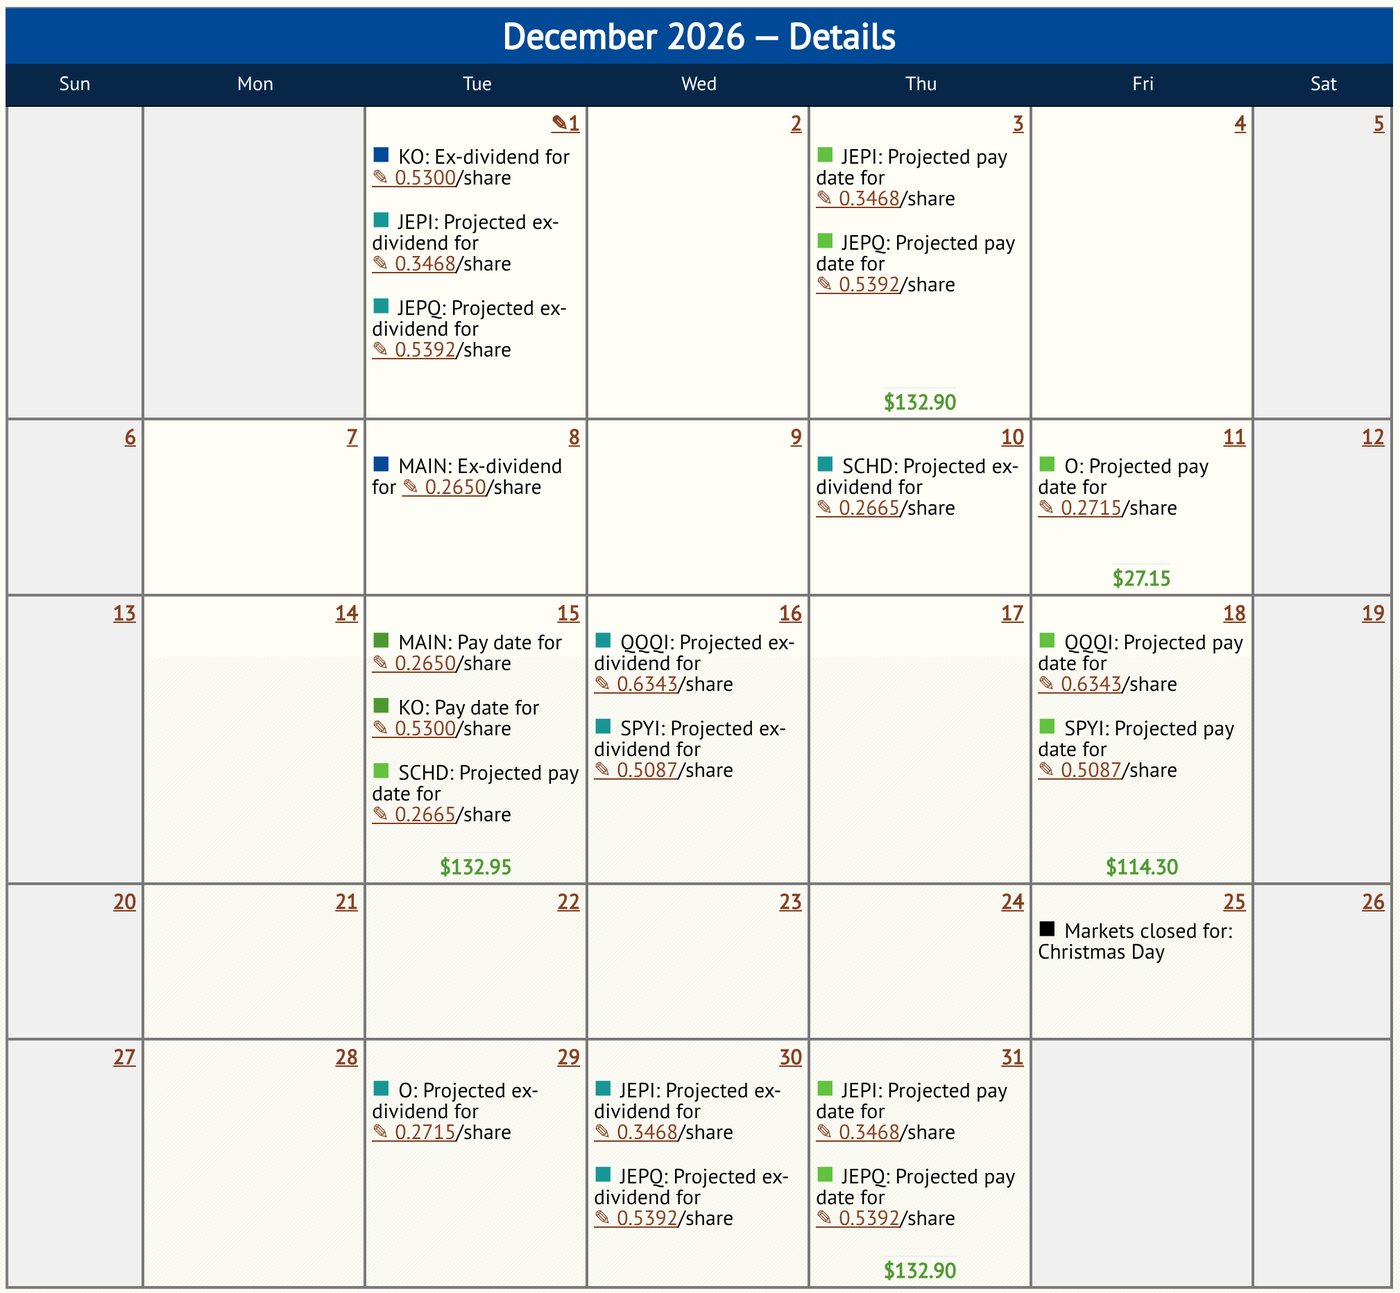
Scroll down and the Details calendar spells out every event with the per-share amount. For example, it shows $KO going ex-dividend on December 1 for $0.53 per share, $SCHD's projected ex-dividend date on December 10, and the daily income total under each pay date.
Step 6: The full-year grid and every month at once
The ALL view is my favorite for a quick health check. At the top is a grid with every holding as a row: shares, current value, next pay date, projected income for each of the next 12 months, the 12-month total and the annualized yield.
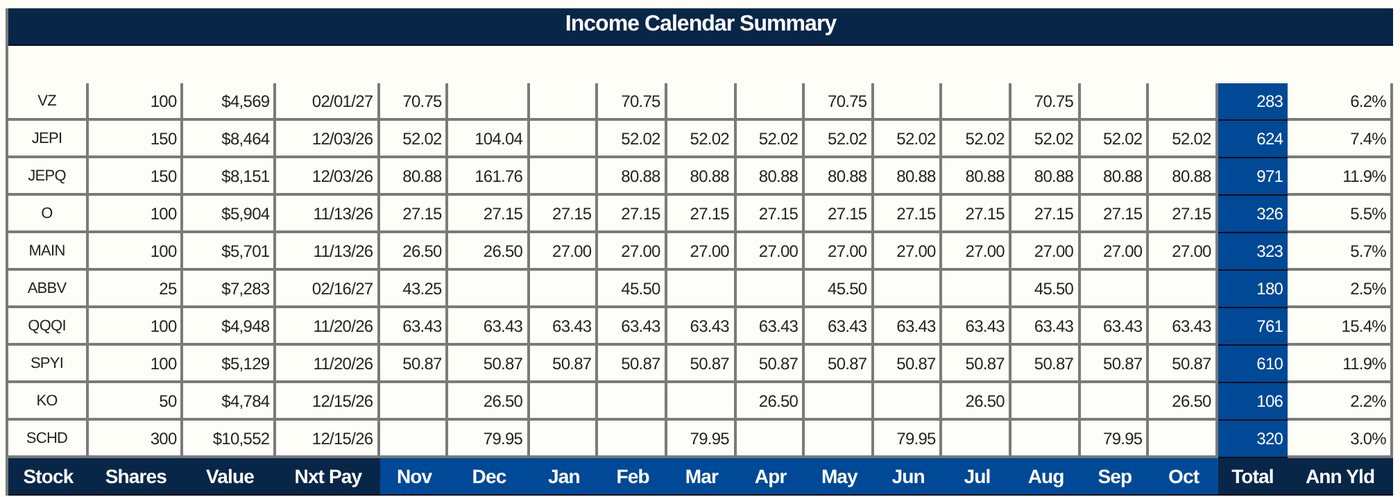
Below the grid it lays out all 12 monthly calendars back to back, so you can scroll through the whole year and see exactly how payments cluster.
See your own portfolio's calendar in a couple of minutes.
Generate my 12-month projection →What you get with the full subscription
The free preview shows you the core views. The paid version (full feature list) turns it into something you use every week:
Brokerage import
Pull in tickers and share counts from your brokerage, or enter positions by hand. No spreadsheet rebuild.
Unlimited holdings and accounts
Track every account in one place, with multiple portfolios and no caps or tiers.
Dividend declaration alerts
Email alerts when a dividend is declared, with the payout amount, ex-date, pay date and implied annualized yield.
Monday "Week Ahead" email
A custom summary every Monday morning of the projected dividend events coming up in your portfolio.
Other income streams
Add pensions, Social Security, rental income or other fixed cash flows to see your whole income picture.
Yield on cost and DRIP mode
See yield on cost next to current yield, and estimate how reinvesting changes future share counts and income.
Watchlists and model portfolios
Build portfolios with tickers you are considering to see the income timing before you buy.
Broad coverage
U.S. and Canadian stocks, ETFs, CEFs, REITs, BDCs, preferreds and mutual funds.
Income Calendar vs. a spreadsheet vs. your brokerage app
| What you need | Income Calendar | Spreadsheet | Brokerage app |
|---|---|---|---|
| 12-month income projection | Built in | Build it yourself | Varies by broker |
| Projected ex-dates and pay dates | On a calendar | Look them up yourself | Varies by broker |
| Income by position | Pie chart and table | Build it yourself | Varies by broker |
| All accounts in one view | Unlimited accounts | Enter them yourself | That broker's accounts |
| Updates when dividends change | Automatic | You update it | Varies by broker |
| Cost | $8.99/month | Free, plus your time | Free |
Who Income Calendar is for
It is a great fit if you:
- Live off your dividends, or plan to, and need to know which months are strong and which are light.
- Own a mix of monthly and quarterly payers across more than one account.
- Hold option income ETFs whose payouts change every month and want projections that update on their own.
- Are tired of maintaining a dividend spreadsheet.
Keep in mind:
- Income Calendar is not a trading platform. It does not place trades or make recommendations. It is a planning and visibility tool.
- Projections are estimates. Dividends can change, especially for option income ETFs, and the tool updates as new dividend information comes in.
Pricing
Pricing is simple: $8.99 per month, one plan, every core feature included, and you can cancel anytime. There are no feature tiers or upgrade gates. To put that in perspective, my test portfolio projected about $4,500 a year in dividends, so a year of Income Calendar would cost roughly 2.4% of that portfolio's projected income.
The free preview is the easy first step: up to 10 holdings, no login, no card, nothing saved. If you like what you see, the paid subscription requires an account and a card and lets you track your full portfolio.
My take
What I like about Income Calendar is that it is built around the question every income investor actually asks: what is coming next, and when?
Running my test portfolio through it took a couple of minutes, and I learned three things I would not have spotted from a yield number: my January would be the lightest month by far, four option income ETFs were driving about two-thirds of the income, and $JEPI and $JEPQ's year-end payment shifts income from January into December. That is exactly the kind of planning information that helps when your dividends pay real bills.
If you are a dividend or income ETF investor, try the free preview with your own top 10 holdings. It costs nothing, takes a few minutes, and you will know right away whether a forward-looking calendar is useful for you.
Try Income Calendar with your own holdings. Free preview, up to 10 holdings.
Try the free preview at DividendTracker.com →Learn moreFrequently asked questions
What is Income Calendar?
Income Calendar is a forward-looking dividend tracker from BNK Invest. You add your holdings and it projects your dividend income for the next 12 months by month, by position and by date, including projected declaration, ex-dividend and pay dates.
How much does Income Calendar cost?
Income Calendar is $8.99 per month with one plan that includes every core feature: 12-month projections, unlimited holdings and accounts, brokerage import, manual entry and dividend alerts. You can cancel anytime.
Is there a free version of Income Calendar?
Yes. The free preview at DividendTracker.com lets you enter up to 10 holdings and see a temporary 12-month income projection. The preview does not need a login, a credit card or a brokerage connection, and nothing you enter is saved. The paid subscription does require an account and a card.
Does Income Calendar work with ETFs?
Yes. It supports U.S. and Canadian stocks, ETFs, closed-end funds, REITs, BDCs, preferreds and mutual funds. In my test it handled monthly payers like JEPI, JEPQ, QQQI and SPYI right next to quarterly payers like SCHD, KO and ABBV.
Are Income Calendar's projections guaranteed?
No. Projections are estimates based on recent dividends and historical payment patterns. Companies and funds can raise, cut, delay or cancel payouts, and high-income option ETFs change their distributions often. The tool updates as new dividend information comes in, but treat every projection as a planning estimate.
Sponsored disclosure: This article is sponsored by BNK Invest, Inc., the company behind Income Calendar. TopDividendETFs.com was paid to create this content. All screenshots come from a test portfolio I built in the Income Calendar free preview on November 6, 2026; projections are estimates based on recent dividend data and are not guarantees of future payments. The example portfolio is for illustration only and is not a recommendation to buy or sell any security. TopDividendETFs.com is for educational purposes only and is not financial advice. Always do your own research.