 Sponsored By
Read carefully before investing. Prospectus: https://lsfunds.com/hubfs/Regulatory/Prospectus.pdf?hsLang=en
When $QQQI's price drops, the dollar payout tends to drop with it, but the yield stays near 14%. All 34 monthly distributions since launch have equaled about 1.14% to 1.25% of the share price right before the ex-date (about 1.18% on average). At today's close of $48.88, that history points to a next payout of roughly $0.58, versus $0.634 last month. That's an estimate, not an announcement.
- Avg. payout
- ~1.18% of price
- Payouts so far
- 33
- Today's close
- $48.88
- Last payout
- $0.634
- Est. next
- ~$0.58
🚨 See Where $QQQI Ranks Among 130+ Income ETFs
TopDividendETFsPRO puts $QQQI next to every income ETF we track with advanced filtering, ratings, live yields, total returns and price decay, so you can see how it really holds up when the market drops. From $12.95/mo, or grab lifetime access.
Try TopDividendETFsPRO →What Happens to $QQQI's Distribution When the Price Drops?
$QQQI just had its second-worst day since it launched (only April 4, 2025 was worse). If you own it for the monthly check, here's the one pattern you need to understand, straight from every payout since 2024.
What Happened Today
On November 5, 2026, $QQQI fell about 5.7% in one day, from $51.82 to $48.88, as the Nasdaq-100 ($QQQ) dropped about 6.5% ($691.95 to $647.05). That puts $QQQI about 15% below its June 2, 2026 high of $57.69, and about 10% below where it closed on October 28 ($54.12).
Notice that $QQQI fell less than $QQQ. That's the option premium doing part of its job as a cushion. But a cushion isn't a wall, and the question I keep getting is the same one: "Does this mean my monthly check is about to get cut?"
I pulled every $QQQI distribution since it launched on January 29, 2024 and lined each one up with the share price right before its ex-date. The answer is pretty clear.
The Pattern: Payout Follows Price
Every single $QQQI payout has been a near-constant slice of the share price.
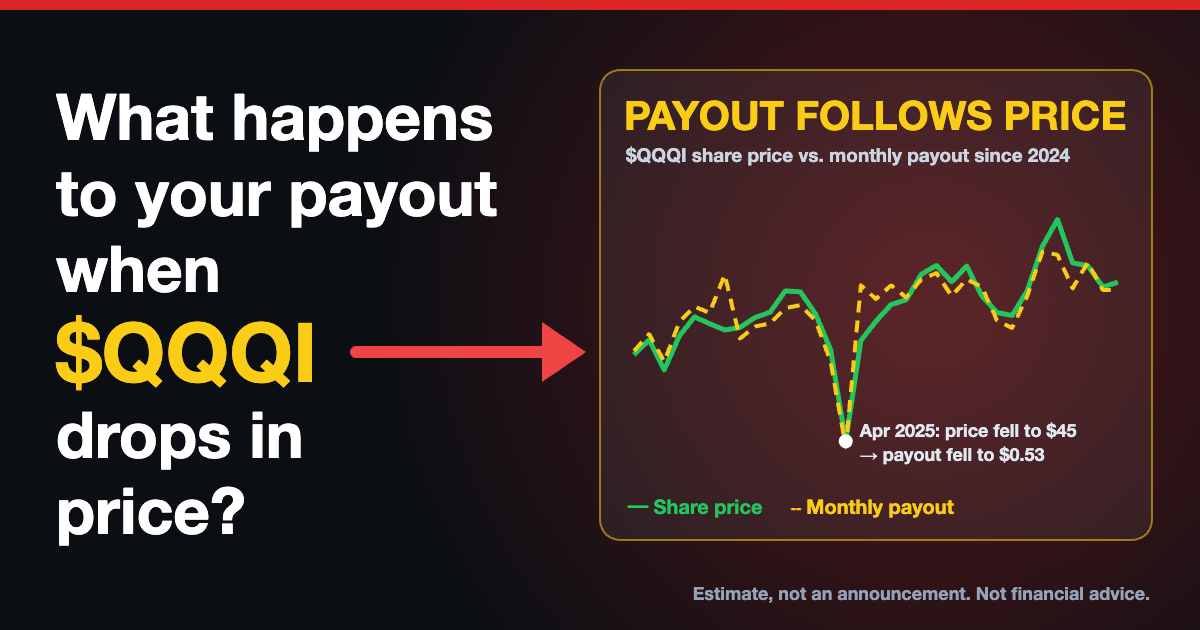
Green line: closing price the trading day before each ex-date (left axis). Gold dashed line: that month's payout (right axis). The right axis is set to exactly 1.18% of the left axis, so when the lines overlap, the payout was right at the average. Source: Yahoo Finance daily closes and distributions, Feb 2024 to Oct 2026.
The two lines are almost the same line. When the price climbed to the $55 to $57 range in 2026, the checks grew to $0.63 to $0.66. When the price sank to $45 in April 2025, the check sank to $0.531. The lowest month paid 1.14% of the price, the highest paid 1.25%, and the average was about 1.18%. Multiply 1.18% by 12 and you get roughly 14% a year, which is right where NEOS's 14.09% distribution rate sits.
Here's every payout since launch, newest first. For the full calendar of declaration and pay dates, see our $QQQI dividend dates for 2026 and the complete $QQQI dividend history.
| Ex-Date | Payout | Price Before Ex-Date | Payout as % of Price |
|---|---|---|---|
| Nov 18, 2026 | $0.584 | $49.55 | 1.18% |
| Oct 21, 2026 | $0.634 | $54.16 | 1.17% |
| Sep 16, 2026 | $0.634 | $53.89 | 1.18% |
| Aug 19, 2026 | $0.652 | $55.07 | 1.18% |
| Jul 22, 2026 | $0.635 | $55.23 | 1.15% |
| Jun 16, 2026 | $0.657 | $57.64 | 1.14% |
| May 20, 2026 | $0.659 | $56.14 | 1.17% |
| Apr 22, 2026 | $0.630 | $53.68 | 1.17% |
| Mar 18, 2026 | $0.609 | $52.31 | 1.16% |
| Feb 18, 2026 | $0.614 | $52.47 | 1.17% |
| Jan 21, 2026 | $0.636 | $53.40 | 1.19% |
| Dec 24, 2025 | $0.641 | $55.05 | 1.16% |
| Nov 26, 2025 | $0.630 | $54.18 | 1.16% |
| Oct 22, 2025 | $0.645 | $55.09 | 1.17% |
| Sep 24, 2025 | $0.641 | $54.60 | 1.17% |
| Aug 20, 2025 | $0.629 | $53.18 | 1.18% |
| Jul 23, 2025 | $0.637 | $52.91 | 1.20% |
| Jun 25, 2025 | $0.628 | $51.99 | 1.21% |
| May 21, 2025 | $0.637 | $50.91 | 1.25% |
| Apr 23, 2025 | $0.531 | $45.32 | 1.17% |
| Mar 26, 2025 | $0.587 | $50.40 | 1.17% |
| Feb 26, 2025 | $0.614 | $52.40 | 1.17% |
| Jan 22, 2025 | $0.624 | $53.62 | 1.16% |
| Dec 24, 2024 | $0.622 | $53.67 | 1.16% |
| Nov 20, 2024 | $0.612 | $52.49 | 1.17% |
| Oct 23, 2024 | $0.610 | $52.19 | 1.17% |
| Sep 25, 2024 | $0.602 | $51.64 | 1.17% |
| Aug 21, 2024 | $0.644 | $51.50 | 1.25% |
| Jul 24, 2024 | $0.619 | $51.85 | 1.19% |
| Jun 26, 2024 | $0.623 | $52.23 | 1.19% |
| May 22, 2024 | $0.613 | $51.17 | 1.20% |
| Apr 24, 2024 | $0.587 | $49.28 | 1.19% |
| Mar 20, 2024 | $0.605 | $50.95 | 1.19% |
| Feb 21, 2024 | $0.594 | $50.12 | 1.19% |
The newest payout, for November 2026, is $0.5838 per share, declared November 17 and paid November 20, per NEOS. With $QQQI closing at $49.55 the day before the ex-date, that is 1.18% of the share price, right in line with every payout before it. October paid $0.6343.
The April 2025 Stress Test
The best real-world example of what a selloff does to $QQQI's check.
Before the January 2025 ex-date, $QQQI traded at $53.62 and paid $0.624. Then came the spring 2025 selloff. $QQQI closed as low as $42.51 on April 8, 2025, and by the April ex-date it was at $45.32. The payout that month fell to $0.531, the lowest in the fund's history and about 15% less than January's.
| Ex-Date | Price Before Ex-Date | Payout | % of Price |
|---|---|---|---|
| Jan 22, 2025 | $53.62 | $0.624 | 1.16% |
| Feb 26, 2025 | $52.40 | $0.614 | 1.17% |
| Mar 26, 2025 | $50.40 | $0.587 | 1.17% |
| Apr 23, 2025 | $45.32 | $0.531 | 1.17% |
| May 21, 2025 | $50.91 | $0.637 | 1.25% |
| Jun 25, 2025 | $51.99 | $0.628 | 1.21% |
Here's the part people forget: it came right back. As the price recovered to $50.91 in May 2025, the payout jumped to $0.637, higher than January's check. The yield on price never broke. Only the dollar amount moved, and it moved in both directions.
How the Option Strategy Works
Why the payout behaves this way, in plain English.
According to NEOS, $QQQI holds the stocks in the Nasdaq-100 and runs a "data-driven call option strategy that may include both sold and purchased NDX index options," which "may provide the opportunity for upside capture in rising equity markets." NEOS doesn't publish the exact strikes or expirations it uses, so the example below is a simple, generic illustration, not $QQQI's actual trades.
Say the Nasdaq-100 index is at 20,000 and the fund sells a call option with a strike slightly above that. The buyer pays the fund a premium up front. Then one of three things happens:
The index falls below the strike
The sold calls expire worthless and the fund keeps the full premium. But the premium only cushions part of the drop.
Result: the price falls, and next month's dollar payout tends to shrink with it.
The index ends near or slightly above the strike
The fund keeps most of the premium and gets the stock gains up to the strike.
Result: this is the sweet spot for a covered call fund.
The index rips well past the strike
The sold calls cost the fund money and upside gets capped. Any calls NEOS buys can win back some of that upside.
Result: you still make money, just less than $QQQ.
Why selloffs aren't all bad for the premium. When markets fall hard, option prices (implied volatility) usually rise. Each new call the fund sells brings in more premium per dollar, which helps $QQQI keep paying about 14% of a lower price. The flip side: selling calls at lower index levels means less room before upside gets capped if the market snaps back fast.
Why the payout scales with the fund's size. $QQQI's 30-day SEC yield was about -0.05% as of September 30, 2026. In other words, the dividends from the Nasdaq-100 stocks don't even cover the 0.68% expense ratio. The money you get each month comes from option premiums (and has been classified as return of capital), and option premium is earned on the fund's assets. Smaller assets per share means a smaller check per share.
Taxes. The NDX index options are taxed as Section 1256 contracts (60% long-term, 40% short-term). NEOS also uses tax-loss harvesting, and distributions have been classified as return of capital based on estimates; the final breakdown comes on Form 1099-DIV. A tax pro can tell you what that means for your account. If you want the full list of things that can go wrong, read our breakdown of $QQQI's biggest risks.
| NEOS Figure | $QQQI |
|---|---|
| Distribution rate | 14.09% |
| Trailing 12-month distribution rate | 14.13% |
| 30-day SEC yield (as of 9/30/2026) | -0.05% |
| Expense ratio | 0.68% |
| Net assets (as of 11/4/2026) | About $14.9 billion |
| NAV total return, 1 year | 7.09% (Nasdaq-100: 10.47%) |
| NAV total return since inception, annualized | 16.63% |
Figures from NEOS as of October 31, 2026 unless noted.
What This Means for the Next Payout
An estimate based on 33 months of history. NEOS has not announced the November payout.
The next $QQQI declaration is listed for November 17, 2026. If the price is still around today's $48.88 then, 1.18% of $48.88 is about $0.58, roughly 9% less than October's $0.634. If the price climbs back to around $54, the same math gives about $0.64, basically unchanged.
| If $QQQI's price is... | Range (1.14% to 1.25%) | At the 1.18% average | vs. Oct's $0.634 |
|---|---|---|---|
| $45.00 | ~$0.51 to $0.56 | ~$0.53 | -16% |
| $48.88 | ~$0.56 to $0.61 | ~$0.58 | -9% |
| $52.00 | ~$0.59 to $0.65 | ~$0.61 | -3% |
| $55.00 | ~$0.63 to $0.69 | ~$0.65 | +2% |
Want to see what that means for your own position over time? Run it on DividendProjection.com, our free dividend projection calculator.
Should You Worry?
- Your dollar income will likely dip. If the price stays lower, expect smaller checks. That's what the data says, and it's what happened in April 2025.
- The yield has held. In 33 months the payout never dropped below 1.14% of the price. A lower check on a lower price is not the same thing as a "cut" in the strategy.
- Total return still depends on the Nasdaq. $QQQI owns the Nasdaq-100. Its NAV total return over the past year was 7.09% versus 10.47% for the index, so it isn't immune to tech selloffs. It just softens them a bit and gives up some upside.
- Reinvesting at lower prices buys more shares. If you reinvest, a lower price means each check buys more shares, which can lift future income when the price recovers.
- The real risk is a long slump. If the Nasdaq stays down for a long time, the price and the payout could stay lower, and a fund paying out about 14% a year could see NAV erosion. So far it hasn't: the price recovered after April 2025 and set new highs in 2026.
If you're new to $QQQI, here's what happened the month it paid its largest distribution ever.
My Takeaway
A 5.7% drop in one day stings. I get it. But I don't look at $QQQI as "$0.63 a month forever." I look at it as about 14% a year of whatever the fund is worth. The data backs that up across all 34 payouts, through the April 2025 crash and back.
So yes, if the price stays near $48.88, I'd expect a smaller check in November. If the Nasdaq bounces, I'd expect the check to bounce with it, just like it did in May 2025. The thing that would actually worry me is a long, grinding Nasdaq bear market, because then the price and the payout both stay lower. That's the trade-off you accept for a 14% yield on tech.
What are you doing with your $QQQI after today: holding, buying, or trimming? Compare 100+ dividend ETFs by yield, total return and price decay on TopDividendETFs.com, free and updated daily.
Frequently Asked Questions: QQQI's Distribution
- Does QQQI cut its distribution when the price drops?Usually the dollar amount goes down with the price, but the yield stays about the same. Across all 34 monthly payouts since launch, every one equaled about 1.14% to 1.25% of the share price right before the ex-date (about 1.18% on average). In the April 2025 selloff the payout fell to $0.531, its lowest ever, then bounced back to $0.637 the next month as the price recovered.
- How much will QQQI's next distribution be?NEOS has not announced it yet; the next declaration is listed for November 17, 2026. If the price is still around $48.88 then, the historical average of 1.18% of price works out to roughly $0.58, versus $0.634 in October. If the price recovers to about $54, it would be closer to $0.64. That is an estimate from past data, not a prediction.
- Why does QQQI's payout follow its share price?$QQQI's income comes from selling Nasdaq-100 (NDX) index call options, not from stock dividends. Its 30-day SEC yield was about -0.05% as of September 30, 2026, so the stocks' dividends don't even cover the 0.68% fee. Option premium scales with the size of the fund's assets, so when the price falls the dollar payout tends to shrink with it.
- Is QQQI's distribution return of capital?NEOS has classified QQQI's distributions as return of capital based on estimates, helped by tax-loss harvesting. The final breakdown is reported on Form 1099-DIV. Its NDX index options are also taxed as Section 1256 contracts (60% long-term, 40% short-term). Talk to a tax professional about your situation.
- What is QQQI's distribution rate?NEOS lists a 14.09% distribution rate and a 14.13% trailing 12-month rate as of October 31, 2026, with a 0.68% expense ratio and about $14.9 billion in net assets as of November 4, 2026. Each monthly payout has worked out to about 1.18% of the share price, which is roughly 14% a year.
Related Posts
QQQI Dividend History
Every $QQQI payout since launch.
QQQI Dividend Dates 2026
Declaration, ex and pay dates.
QQQI's Biggest Risks
What could go wrong with $QQQI.
QQQI's Largest Distribution Ever
The month $QQQI paid its biggest check.
DividendProjection.com
Project your dividend income for decades.
⭐ Track $QQQI and 130+ Income ETFs in One Place
TopDividendETFsPRO is the screener I built for serious income investors: advanced filtering, ratings, live yields, total returns and price decay for 130+ income ETFs like $QQQI, $SPYI, $JEPQ and $GPIQ. See which funds hold up when the market drops.
From $12.95/mo or one-time lifetime access
Unlock TopDividendETFsPRO →
Sponsored By
Read carefully before investing. Prospectus: https://lsfunds.com/hubfs/Regulatory/Prospectus.pdf?hsLang=en
Important Disclaimer
TopDividendETFs.com is published by Dividend Empire LLC for educational and informational purposes only. This is not financial advice and not a recommendation to buy or sell any security. Prices and distributions are from Yahoo Finance daily closes, and fund figures are from NEOS, as of November 5, 2026 unless noted; they change constantly. "Price before ex-date" is the closing price the trading day before each ex-date. Estimated future payouts are hypothetical calculations based on past distributions, not predictions or announcements; NEOS sets each distribution and actual amounts will differ. Distributions may include return of capital, and you can lose money. Past performance does not guarantee future results. Do your own research and consult a licensed financial advisor or tax professional before investing.